Trendalytics
Trendalytics is a retail analytics solution that helps merchants, marketers, and designers contextualize consumer demand and market supply. While the company aims to cement in the Fashion industry as a product insights and analysis tool, our goal is to seamlessly integrate our platform into our users’ daily workflow.
I am accountable for the research, prototyping, testing, interaction design, and data visualization.

My Process:
1. Define the Problem Scope
2. Identify our Audience
3. Prioritize the Pain-Points
4. Determine the Expected Behavior
5. Conduct Competitive Research
6. Explore Options
7. Gather Feedback / User Test
8. Create the Designs
9. Document Requirements with Developers
10. QA Test
11. Make Improvements
12. Launch
13. Gather Feedback
14. Measure Results
The Challenge
Reporting on sales and market behavior is the most important step in the retail industry. Most retailers are demanding more analysis on their competition, however, for many merchants, to collect this data is still very manual and time consuming. For Trendalytics, this is an opportunity to perform the needed data collection and product analysis in an efficient way. Our challenge is to combine the market information and contextualize it into action-driven insights, resulting in a more engaging and desired data-analysis experience.


The existing report function was limited to analyzing product assortment or pricing architecture in separate reports and lacked the needed insights for our users.
User Research
In addition to knowing who our users are and their daily tasks, it is important that I understand how they work and how they understand information.
I structured and conducted the first user interviews and small group workshops for this feature, which had not been a formal step in the development for the company. Based on the insights that was gathered, I updated our User Personas and defined some key product experiences for the launch version of the product.


Client Feedback
“I am overwhelmed with all the metrics”
“I don’t have time to analyze the information”
“I don’t need data, I have the merchant’s eye”
“I don’t want to do the extra work”
Product Experiences
Nothing too complex
Action oriented & to the point
Reflect on what is in the real world
Fit into the workflow
New Insights
The interviews also validated some user pain-points and prioritized our list of possible updates.
One Click Reporting
A key segment of our clients are people who need the information presented in a quick and easy to distribute format.
Information Together
Currently, clients will run reports for the same categories for pricing, discount, product assortment separately. They would like to run one report and only once.
Visual Representation
One of the company’s product principle is to represent and interpret raw data in an easy to understand, visual manner. Our clients expect this when they chose to subscribe to our platform.
Developing the Idea
Planning and Scope definition
I presented frameworks and mockups to share the product vision and content strategy from a design perspective with the Product Manager. This helped balance business requirements to customer goals, aligning decision making and milestone deliverables.
Execution and Validation
I created user journeys, wireframes, prototypes, and design specs throughout the project lifecycle. Materials were shared with executives, investors, as well as client stakeholders.
There were two components that needed an update:
1. the selection process to generate the report
2. the information output of the report itself


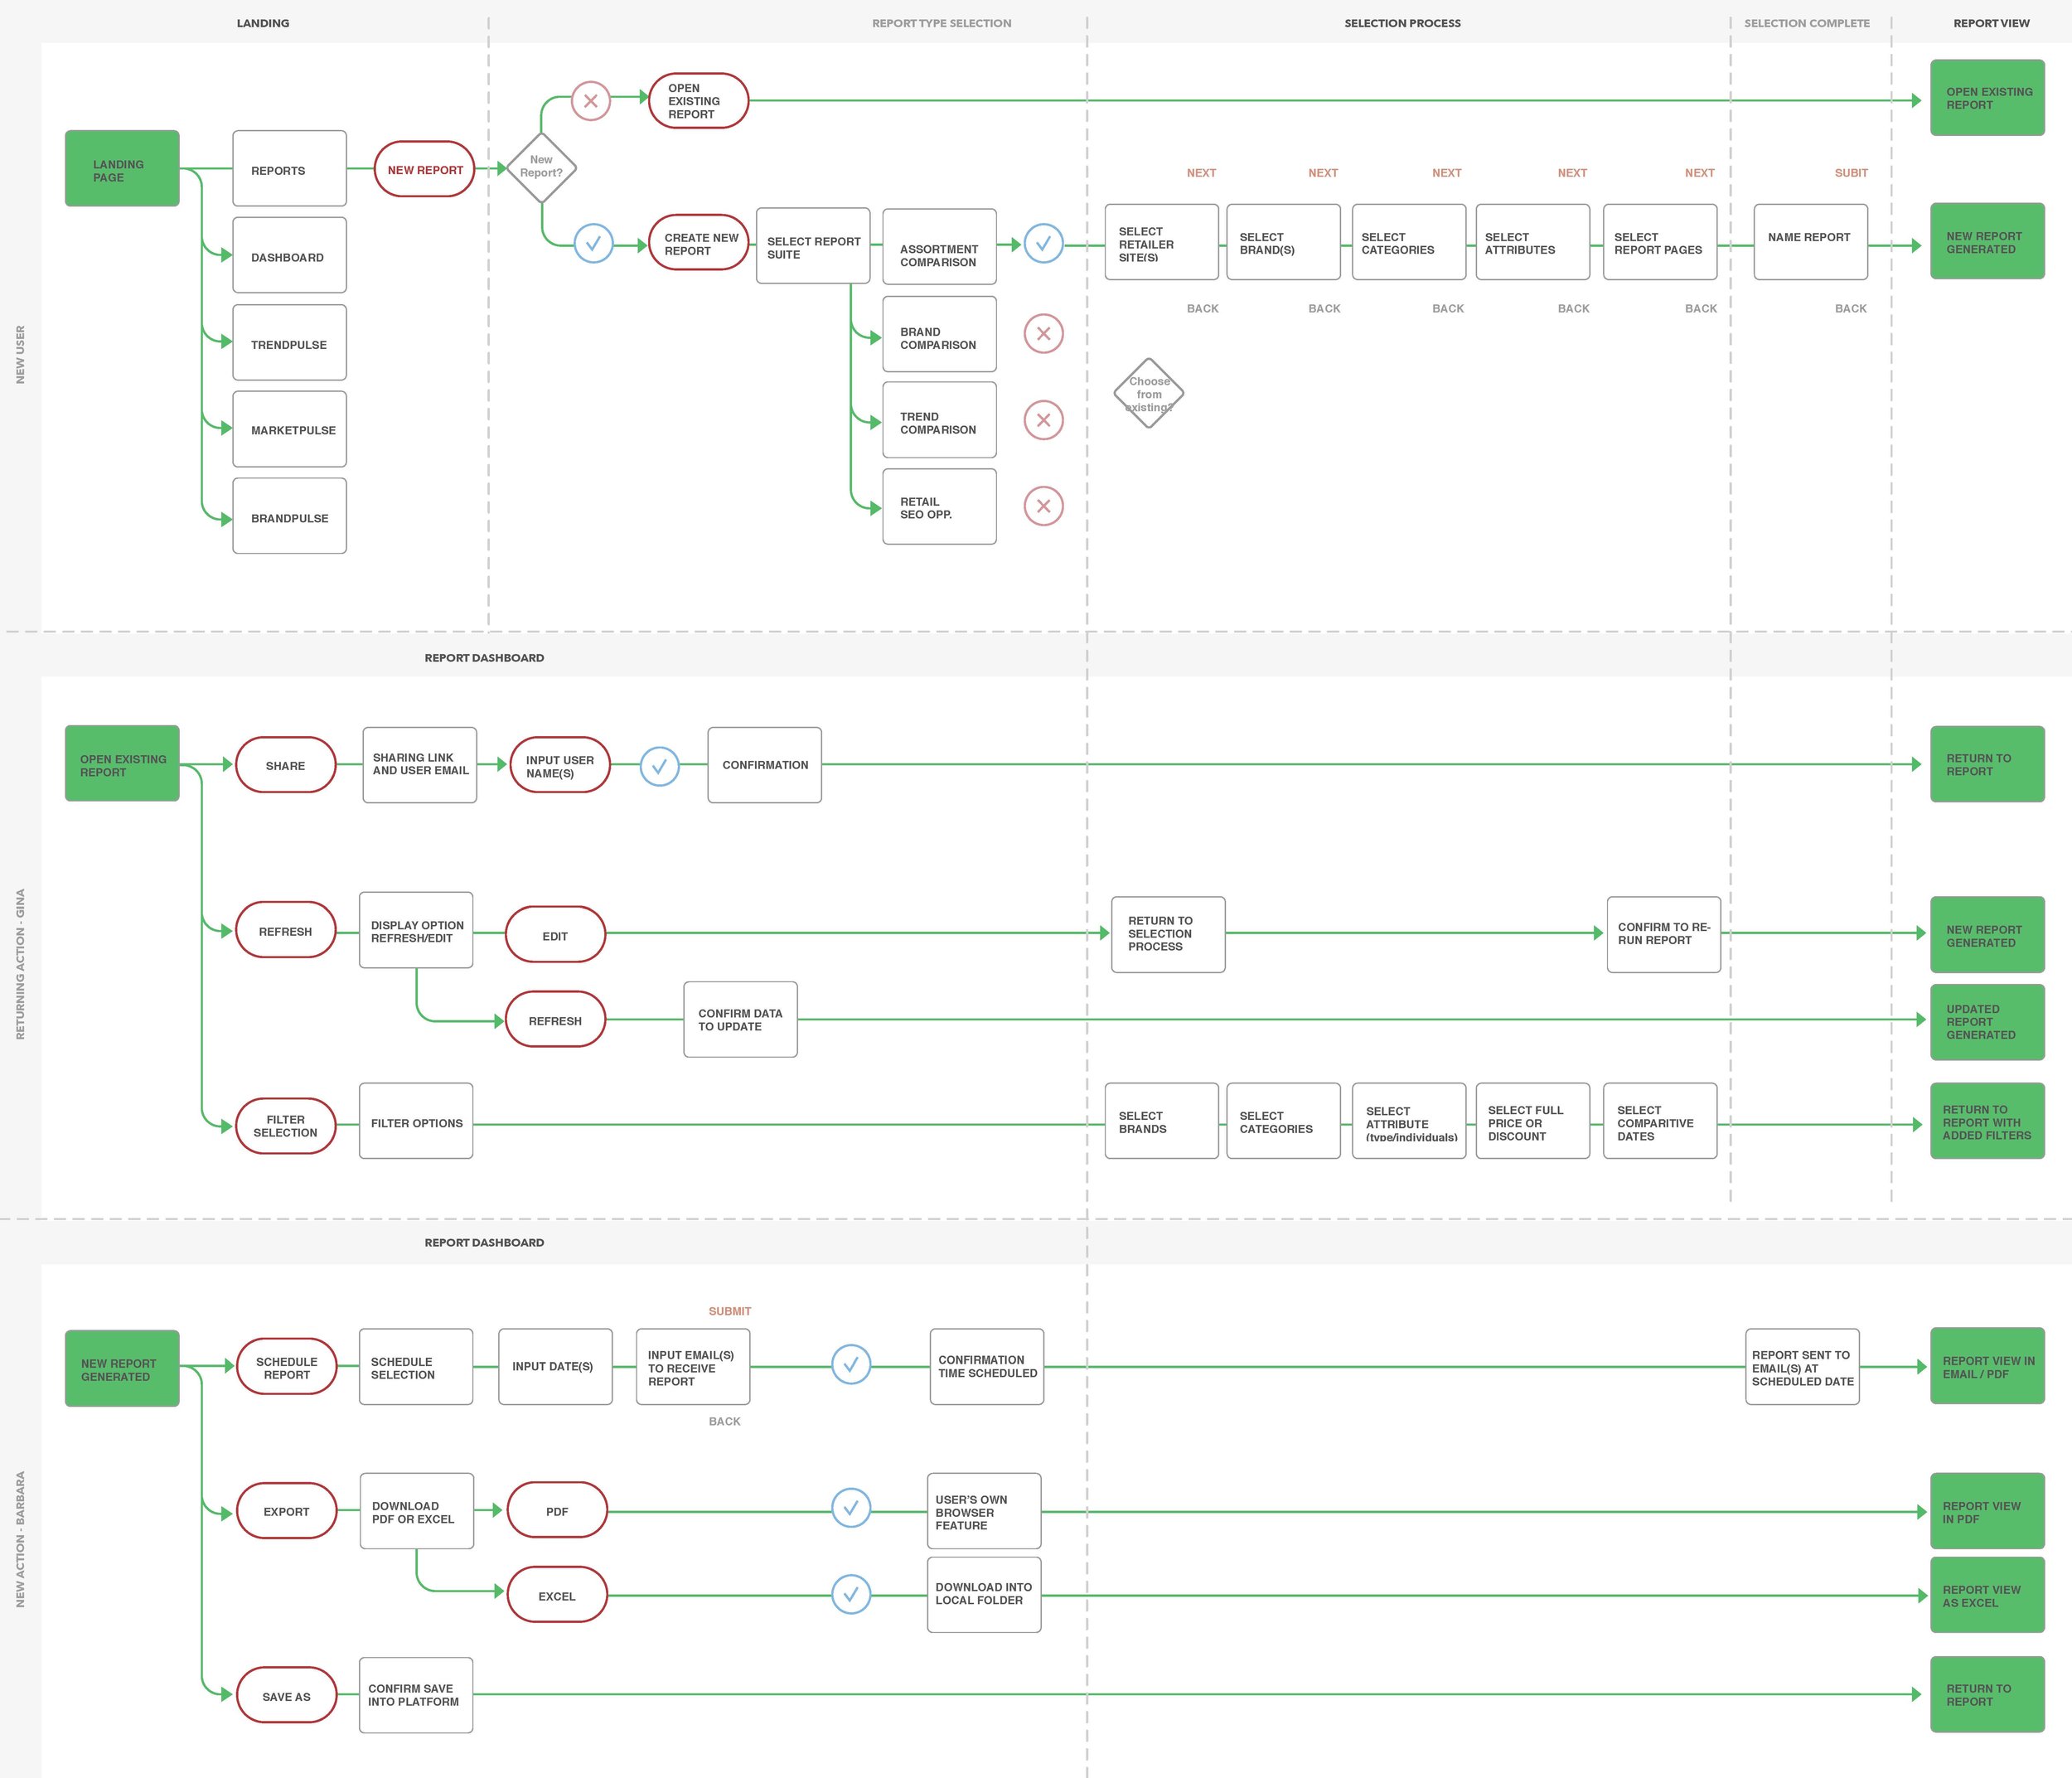
User flow for creating a report based on the user status and our primary user persona.

Initial wireframe of the new report prioritizing key information needed for our users to complete their given tasks.
Requirements and Design Specs
I created a number of documentation for the project to communicate requirements to the engineering team.
The documents defined specific calculations, user interactions, edge cases, and error indicators.


Launch Version
I conducted another round of user testing and fixed a few small interactions before the release.

The Impact
This upgrade includes the ability to select more brands and retail sites to compare, one report for all product performance metrics, better visualizations, and exporting capabilities.
Overall, the new reports have been well received just in the first 6 months of the release.
"Honestly, when i first saw the product, i thought ok cool, but it was going to be "when i have time"... but then my workflow was completely changed when the reports rolled out. it's such an important part of my market prep!"
“It’s quite intuitive, so it’s easy to follow.”
"I thought the assortment comparison report is absolutely fantastic and I am very excited to have access to more reports like that. I am so impressed by how in-depth they are."
“This made Trendalytics my favorite tool now because none of the other tools we use does this.”
"The attribute report was the first report that we can truly see as a sales (in the wholesale sense)-focused part of the platform.”